Hotelling ellipses for ggplot2
geom_hotelling.RdHotelling ellipses for ggplot2
Usage
geom_hotelling(
  mapping = NULL,
  data = NULL,
  position = "identity",
  ...,
  level = 0.95,
  type = "t2data",
  robust = FALSE,
  npoints = 100,
  na.rm = FALSE,
  show.legend = NA,
  inherit.aes = TRUE
)
Arguments
- mapping
Set of aesthetic mappings created by
aes(). If specified andinherit.aes = TRUE(the default), it is combined with the default mapping at the top level of the plot. You must supplymappingif there is no plot mapping.- data
The data to be displayed in this layer. There are three options:
If
NULL, the default, the data is inherited from the plot data as specified in the call toggplot().A
data.frame, or other object, will override the plot data. All objects will be fortified to produce a data frame. Seefortify()for which variables will be created.A
functionwill be called with a single argument, the plot data. The return value must be adata.frame, and will be used as the layer data. Afunctioncan be created from aformula(e.g.~ head(.x, 10)).- position
A position adjustment to use on the data for this layer. This can be used in various ways, including to prevent overplotting and improving the display. The
positionargument accepts the following:The result of calling a position function, such as
position_jitter(). This method allows for passing extra arguments to the position.A string naming the position adjustment. To give the position as a string, strip the function name of the
position_prefix. For example, to useposition_jitter(), give the position as"jitter".For more information and other ways to specify the position, see the layer position documentation.
- ...
Additional parameters passed to underlying
ggplot2::geom_polygon()or toggplot2::layer().- level
Either coverage probability (for type = "t2data" or "c2data") or confidence level (for type = "t2mean").
- type
t2data - Hotelling T2 data ellipse; t2mean - Hotelling confidence interval for the mean; c2data - normal data ellipse (using chi squared distribution).
- robust
If TRUE, then robust estimates of mean and covariance are used
- npoints
Number of points to estimate
- na.rm
Logical. Should missing values be removed? Default is FALSE.
- show.legend
logical. Should this layer be included in the legends?
NA, the default, includes if any aesthetics are mapped.FALSEnever includes, andTRUEalways includes. It can also be a named logical vector to finely select the aesthetics to display. To include legend keys for all levels, even when no data exists, useTRUE. IfNA, all levels are shown in legend, but unobserved levels are omitted.- inherit.aes
If
FALSE, overrides the default aesthetics, rather than combining with them. This is most useful for helper functions that define both data and aesthetics and shouldn't inherit behaviour from the default plot specification, e.g.annotation_borders().
Details
This geom adds data or confidence ellipses to the plot. See
hotelling_ellipse() documentation for more information.
Examples
pca <- prcomp(iris[, 1:4], scale.=TRUE)
df <- cbind(iris, pca$x)
library(ggplot2)
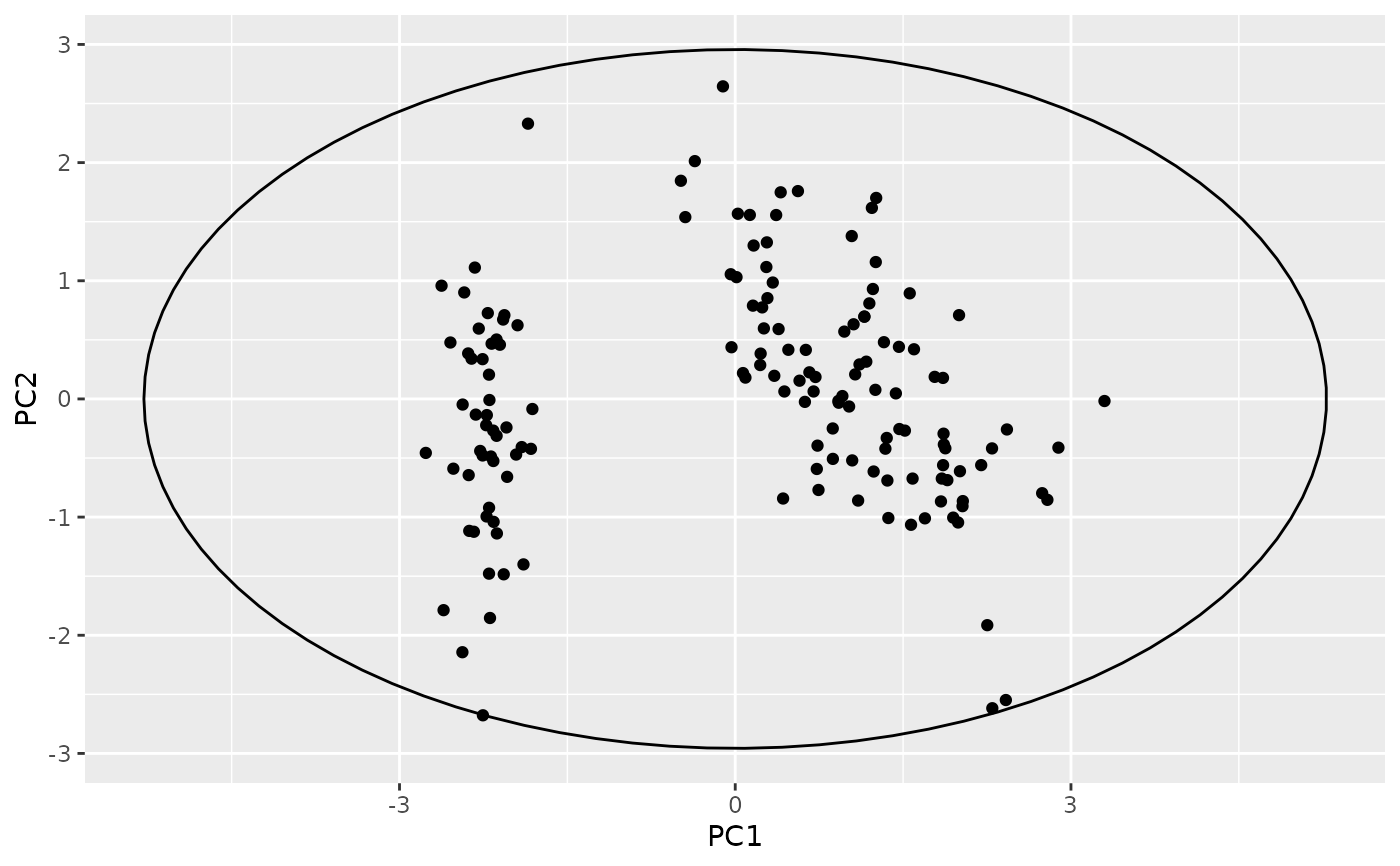
ggplot(df, aes(PC1, PC2)) +
geom_hotelling(level=.99) +
geom_point()
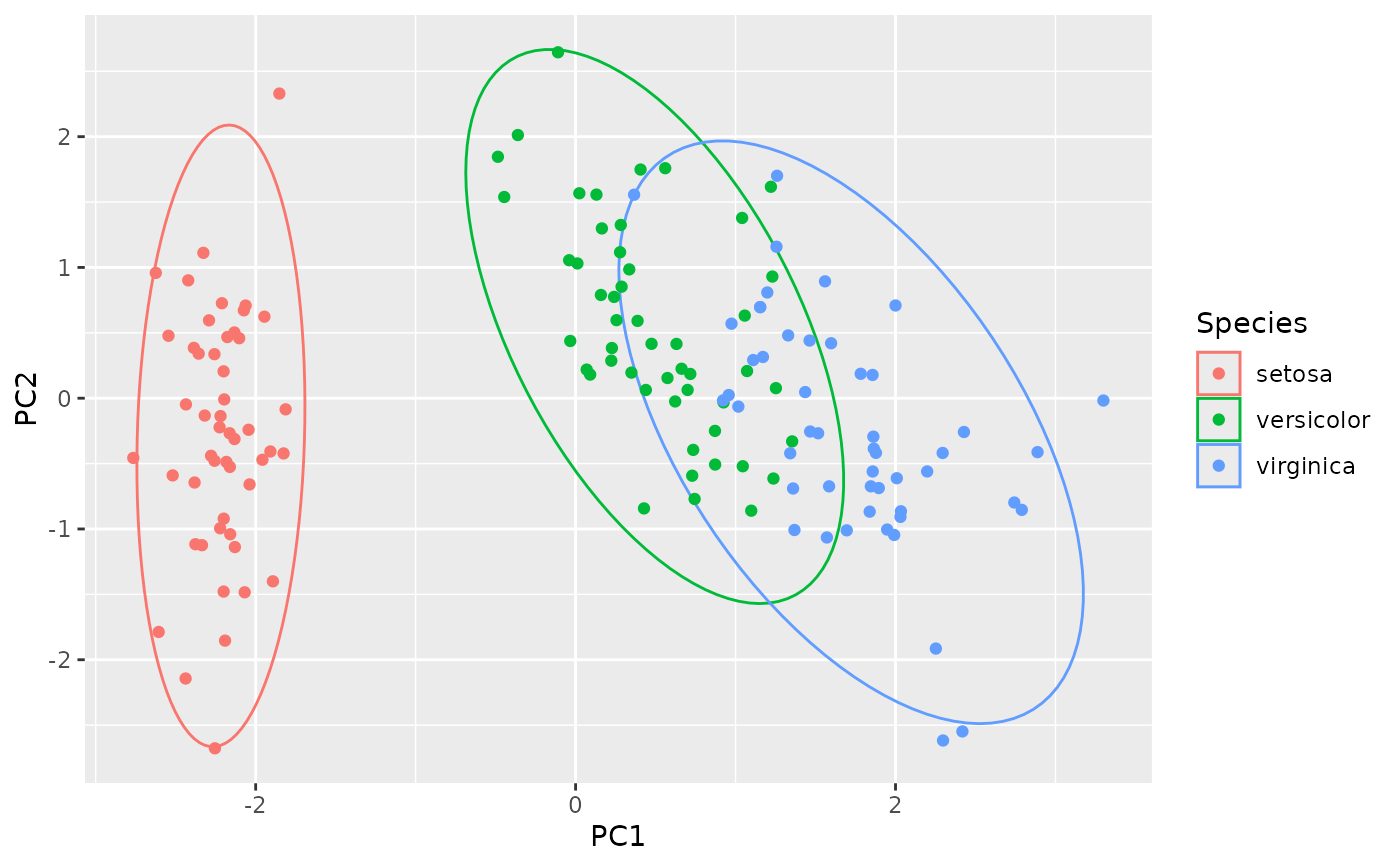
 ggplot(df, aes(PC1, PC2, color=Species)) +
geom_hotelling() +
geom_point()
ggplot(df, aes(PC1, PC2, color=Species)) +
geom_hotelling() +
geom_point()
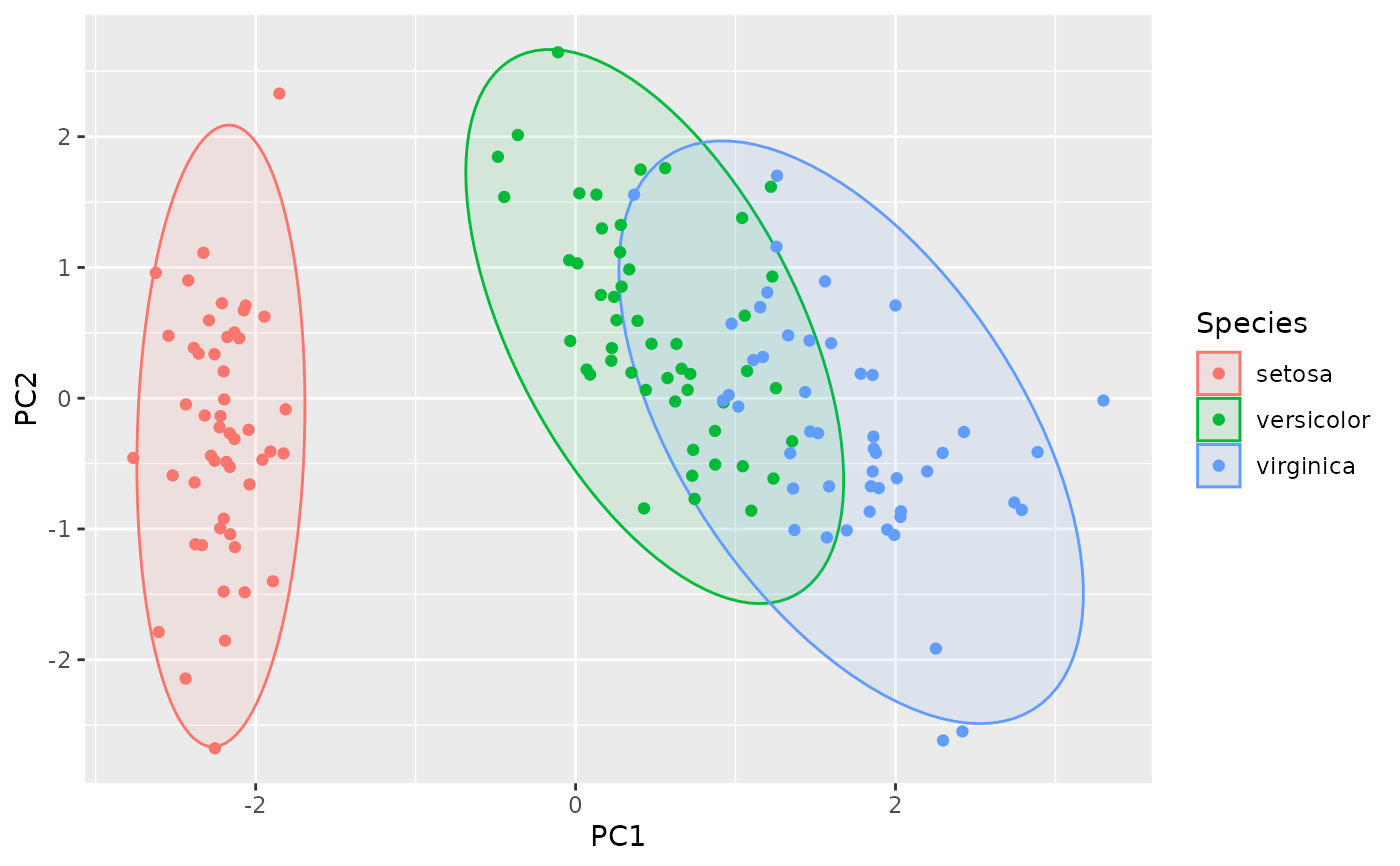
 ggplot(df, aes(PC1, PC2, color=Species)) +
geom_hotelling(alpha=0.1, aes(fill = Species)) +
geom_point()
ggplot(df, aes(PC1, PC2, color=Species)) +
geom_hotelling(alpha=0.1, aes(fill = Species)) +
geom_point()
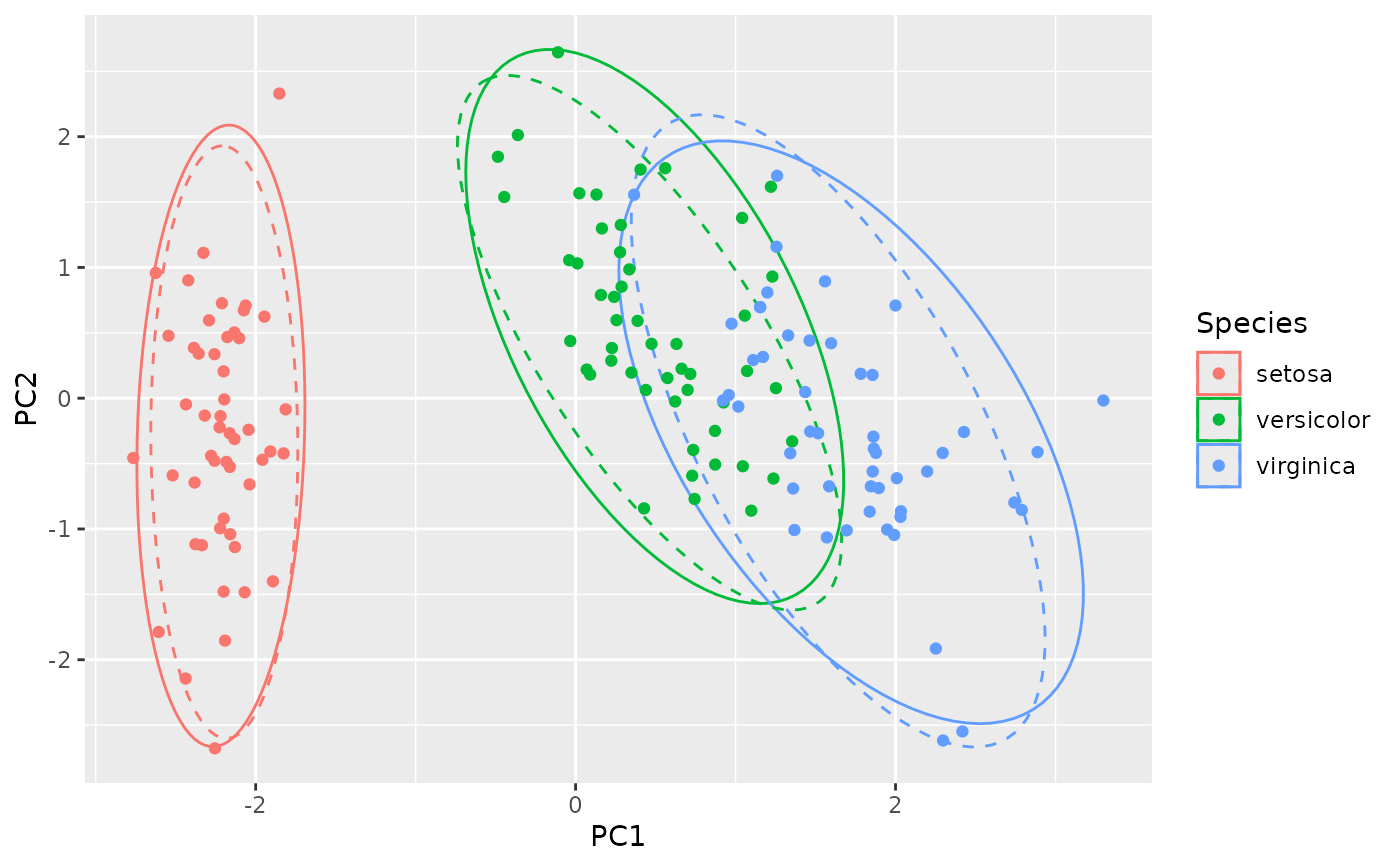
 # compare the robust and regular approaches:
ggplot(df, aes(PC1, PC2, color=Species)) +
geom_hotelling() +
geom_hotelling(robust = TRUE, linetype = "dashed") +
geom_point()
# compare the robust and regular approaches:
ggplot(df, aes(PC1, PC2, color=Species)) +
geom_hotelling() +
geom_hotelling(robust = TRUE, linetype = "dashed") +
geom_point()