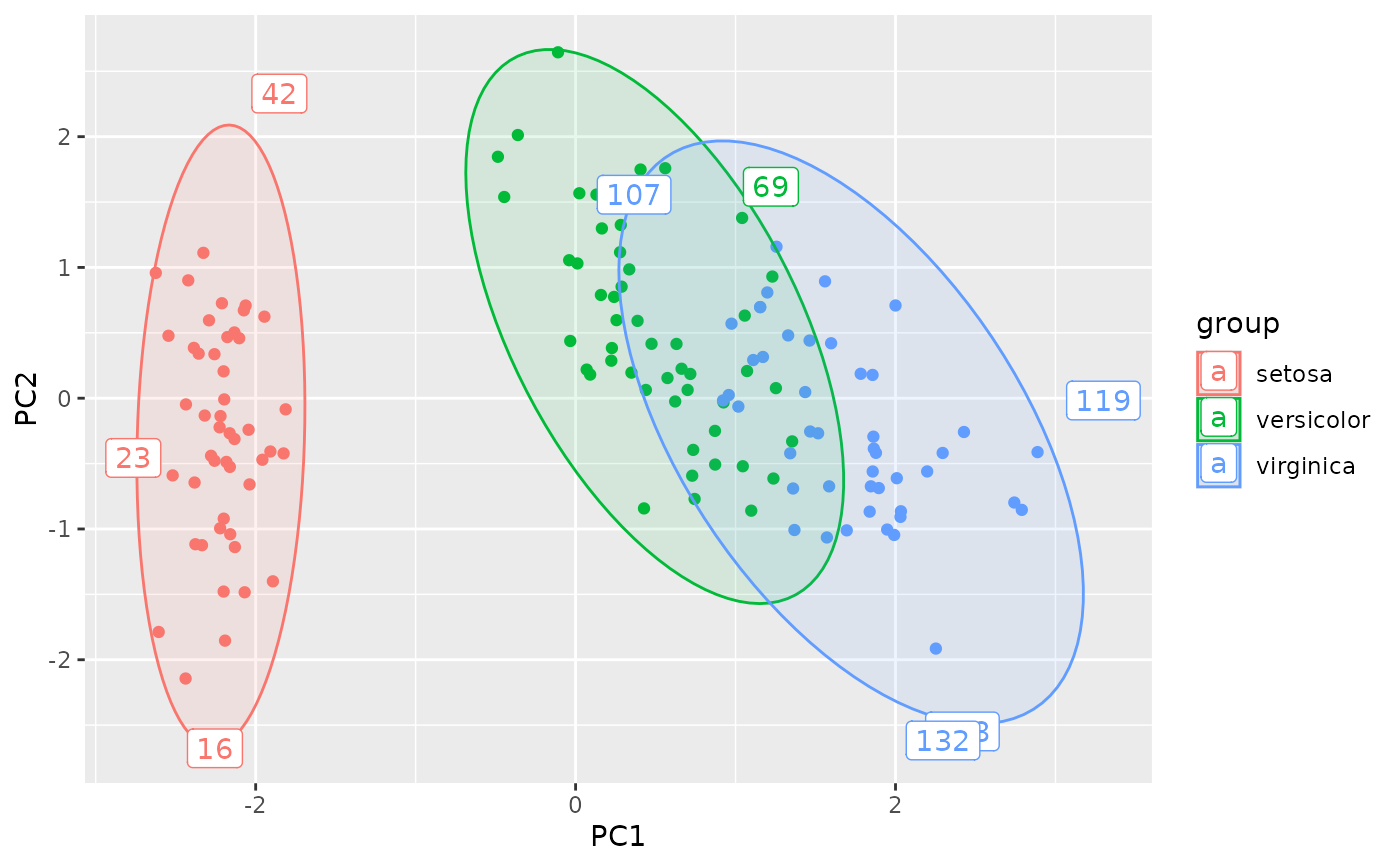
Automatic plotting of PCA objects
autoplot.prcomp.RdAutomatic plotting of PCA objects
Arguments
- object
An object of prcomp class
- dims
Dimensions to plot
- biplot
whether to show the loadings as well as the scores
- group
Groups of the data to be shown on the plot
- ...
ignored
- labels
optionally, a vector of labels for showing the outliers. If NULL, the outliers will be identified by row number.
- type
The type of the coverage / confidence area shown by
autolayer.prcomp, can be one of t2data (T² Hotelling coverage), c2data (chi-squared coverage) or t2mean (T-squared based confidence area for the group mean).- level
Either coverage probability (for type = "t2data" and "c2data") or confidence level (for type = "t2mean").