class: center, middle, inverse, title-slide .title[ # Lecture 12: Visualizing Bioinformatics ] .subtitle[ ## BE_22 Bioinformatics SS 24 ] .author[ ### January Weiner ] .date[ ### 2024-07-12 ] --- class:empty-slide,myinverse background-image:url(images/napoleon.jpg) ??? Napoleon invasion 24.6 1812 * lack of supply * bad roads – slow supply train * lack of water and heat * desertion --- class:empty-slide,myinverse background-image:url(images/map_invasion.jpg) --- .mycenter[ Charles Joseph Minard ] ??? 1781-1870 civil engineer: dams, canals, bridges napoleon campaign map – 1869 retired with 70 --- class:empty-slide,myinverse background-image:url(images/minard.png) --- class:empty-slide,myinverse background-image:url(images/minard_english.png) --- .mycenter[A gallery of bioinformatic visualisations] --- class:empty-slide,myinverse background-image:url(images/taco.webp) ??? https://www.nature.com/articles/ncomms10519 --- ## Density plots .center[ <!-- --> ] --- ## Correlograms ```r library(ggcorrplot) # Correlation matrix data(mtcars) corr <- round(cor(mtcars), 1) # Plot ggcorrplot(corr, hc.order = TRUE, type = "lower", lab = TRUE, lab_size = 3, method="circle", colors = c("tomato2", "white", "springgreen3"), title="Correlogram of mtcars", ggtheme=theme_bw) ``` --- ## Correlograms .center[ <!-- --> ] --- class:empty-slide,myinverse background-image:url(images/sequence_bundle.webp) ??? https://bmcproc.biomedcentral.com/articles/10.1186/1753-6561-8-S2-S8 Sequence Bundles comparing amino acid distribution and correlation in the AKL domain. Bundled visualisation plots sequences as stacked lines against a Y-axis of letters arranged on a scale representing amino acid hydrophobicity. The lines' curved paths expose the conservation of residues by converging at matched positions. Their place relative to letters on the Y-axis exposes patterns in functionality. The consensus sequence is indicated. Lines representing two groups of organisms differ by colour: Gram-positive bacteria (black lines) and Gram-negative bacteria (blue lines). The visualisation is generated from a total of 1809 AKL protein sequences. The number of samples is: 923 Gram-negative sequences vs. 886 Gram-positives, which is in 100:96 ratio. --- class:empty-slide,myinverse background-image:url(images/reassortment.gif) ??? https://pubmed.ncbi.nlm.nih.gov/23939975/ "Reassortment and migration analysis of Crimean-Congo haemorrhagic fever virus" Predicted migration events for (a) S_dataset_a and (b) S_dataset_b using migraphyla and the estimated trees in Fig. 3. The colours of the inner and outer circles represent the source and sink countries. A space between the inner and outer circles indicates the virus was transmitted from the country on the inner circle to the country on the outer circle. In contrast, if the inner and outer circles are connected, this means the virus is transmitted from the country on the outer circle to the country on the inner circle. The width of the link between two countries corresponds to the number of migration events and colour of the link represents the origin of migration. Grey links indicate migration events with a significant P value, but lacking sFDR support. Only migration events with P<0.05 are shown. See Fig. 3 for abbreviations. --- class:empty-slide,myinverse background-image:url(images/mechanical.png) ??? https://journals.plos.org/plosone/article?id=10.1371/journal.pone.0204309 E - Elastic G – shear epsilon – strain to failure sigma t – tensile strength sigma c – compressive strength sigma f – flexural strength KIC fracture toughness uR resillience H hardness IS impact strength --- class:empty-slide,myinverse background-image:url(images/Coexpression-clustering1.jpg) ??? https://www.nature.com/articles/nature13182 Collapsed coexpression network derived from 4,882 coexpression groups (one node is one group of promoters; 4,664 groups are shown here) derived from expression profiles of 124,090 promoters across all primary cell types, tissues and cell lines (visualized using Biolayout Express3D (ref. 45), r > 0.75, MCLi = 2.2). For display, each group of promoters is collapsed into a sphere, the radius of which is proportional to the cube root of the number of promoters in that group. Edges indicate r > 0.6 between the average expression profiles of each cluster. Colours indicate loosely-associated collections of coexpression groups (MCLi = 1.2). Labels show representative descriptions of the dominant cell type in coexpression groups in each region of the network, and a selection of highly-enriched pathways (FDR < 10−4) from KEGG (K), WikiPathways (W), Netpath (N) and Reactome (R). Promoters and genes in the coexpression groups are available online a --- class:empty-slide,myinverse background-image:url(images/wordcloud.png) --- ## Edward Tufte .pull-left[ .center[ *“Graphical excellence is that which gives to the viewer the greatest number of ideas in the shortest time with the least ink in the smallest space.”* ] ] .pull-right[  ] --- class:empty-slide,mywhite background-image:url(images/tufte-books.png) --- .mycenter[ Data visualization is all about communication. Just like in graphics design, less is more. To get a good graphics remove all excess ink. ] --- ## Reproducibility of visualisations * It should be absolutely clear what data was used to generate the visualization * The data must be accessible (some journals require a data file for each figure!) * The visualization code should likewise be published --- ## Checklist for making graphs * What do I want to say? * What do I *need* to say? * What part of my information is redundant? * What is the standard way of displaying the information in my field? * Is the data accessible for others? Resist the temptation of showing every bit of data. If necessary, put it in the supplementary materials. --- ## Average MPG depending on number of cylinders ```r p <- mtcars %>% group_by(cyl) %>% summarise(mean_mpg=mean(mpg)) %>% mutate(cyl=factor(cyl)) %>% ggplot(aes(x=cyl, y=mean_mpg, fill=cyl)) p + geom_bar(stat="identity", mapping=aes(fill=cyl)) + theme(axis.line=element_line(size=1, arrow=arrow(length=unit(0.1, "inches")))) ``` --- ## All bells and whistles <!-- --> --- .mycenter[*“Clutter and confusion are failures of design, not attributes of information.”* (Tufte)] --- ## Remove legend <!-- --> --- ## Remove axes <!-- --> --- ## Remove color <!-- --> --- .mycenter[ Do not use more than one channel to display given information. If you use X axis to differentiate between groups, do not use color to do the same. ] --- ## Narrow bars <!-- --> --- ## Remove vertical grid <!-- --> --- ## Remove grey background <!-- --> --- ## Add meaningful labels .pull-left[ <!-- --> ] .pull-right[ <!-- --> ] --- --- .pull-left[ ### Box plots: default R: ```r boxplot(hwy ~ class, data=mpg) ``` <!-- --> ] .pull-right[ ### Box plots: ggplot2 ```r mpg %>% ggplot(aes(x=class, y=hwy)) + geom_boxplot() ``` <!-- --> ] --- ## Box + scatter plots .pull-left[ ```r mpg %>% ggplot(aes(x=class, y=hwy)) + geom_boxplot() + geom_dotplot(binaxis="y", stackdir="center", fill="grey", dotsize=.3) ``` ] .pull-right[ <!-- --> ] --- .mycenter[ Whenever possible, show the actual data points. Only if there are too many of them, use a box plot or a violin plot. Never use bar plots. ] --- ## Box plots: Tufte .pull-left[ ```r toupper1st <- function(x) paste0(toupper(substring(x, 1, 1)), substring(x, 2)) mpg %>% mutate(class=toupper1st(class)) %>% ggplot(aes(class, hwy)) + geom_tufteboxplot() + theme_tufte() + xlab("") + theme(axis.text=element_text(size=14), axis.title.y= element_text(size=18, margin=margin(0,20,0,0))) + theme(axis.ticks.x=element_blank()) + theme(axis.text.x= element_text(margin=margin(30,0,0,0))) ``` ] .pull-right[ <!-- --> ] --- .center[ <!-- --> ] --- .mycenter[ *“Above all else show the data.”* (Tufte) ] --- .mycenter[ Common problems and solutions ] --- ## Avoid bar charts * Bar charts have their purpose: showing proportions or absolute quantities (1 value per bar) * Y axis must always start at 0, because bar charts communicate with the bar surface area * Bar charts are often misused to show sample means and sample spread; they should be replaced by box plots, violin plots or dot plots. *Editorial. "Kick the bar chart habit." Nature Methods 11 (2014): 113.* --- 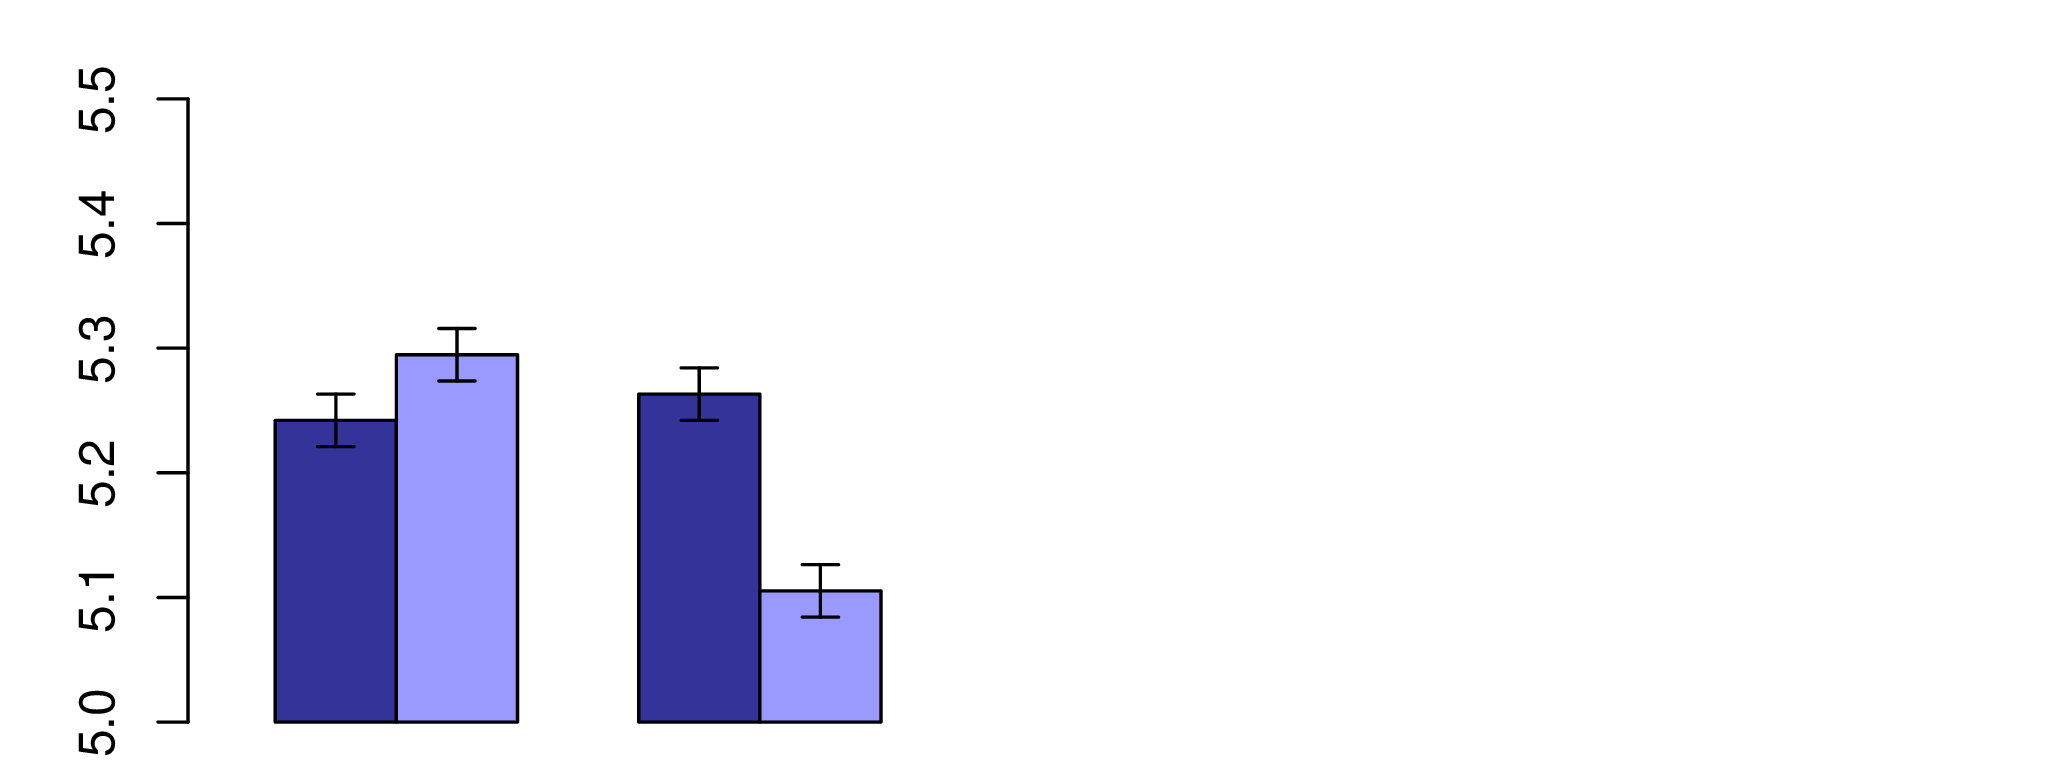 .myfootnote[ *Kramer, Adam DI, Jamie E. Guillory, and Jeffrey T. Hancock. "Experimental evidence of massive-scale emotional contagion through social networks." Proceedings of the National Academy of Sciences 111.24 (2014): 8788-8790.* ] --- 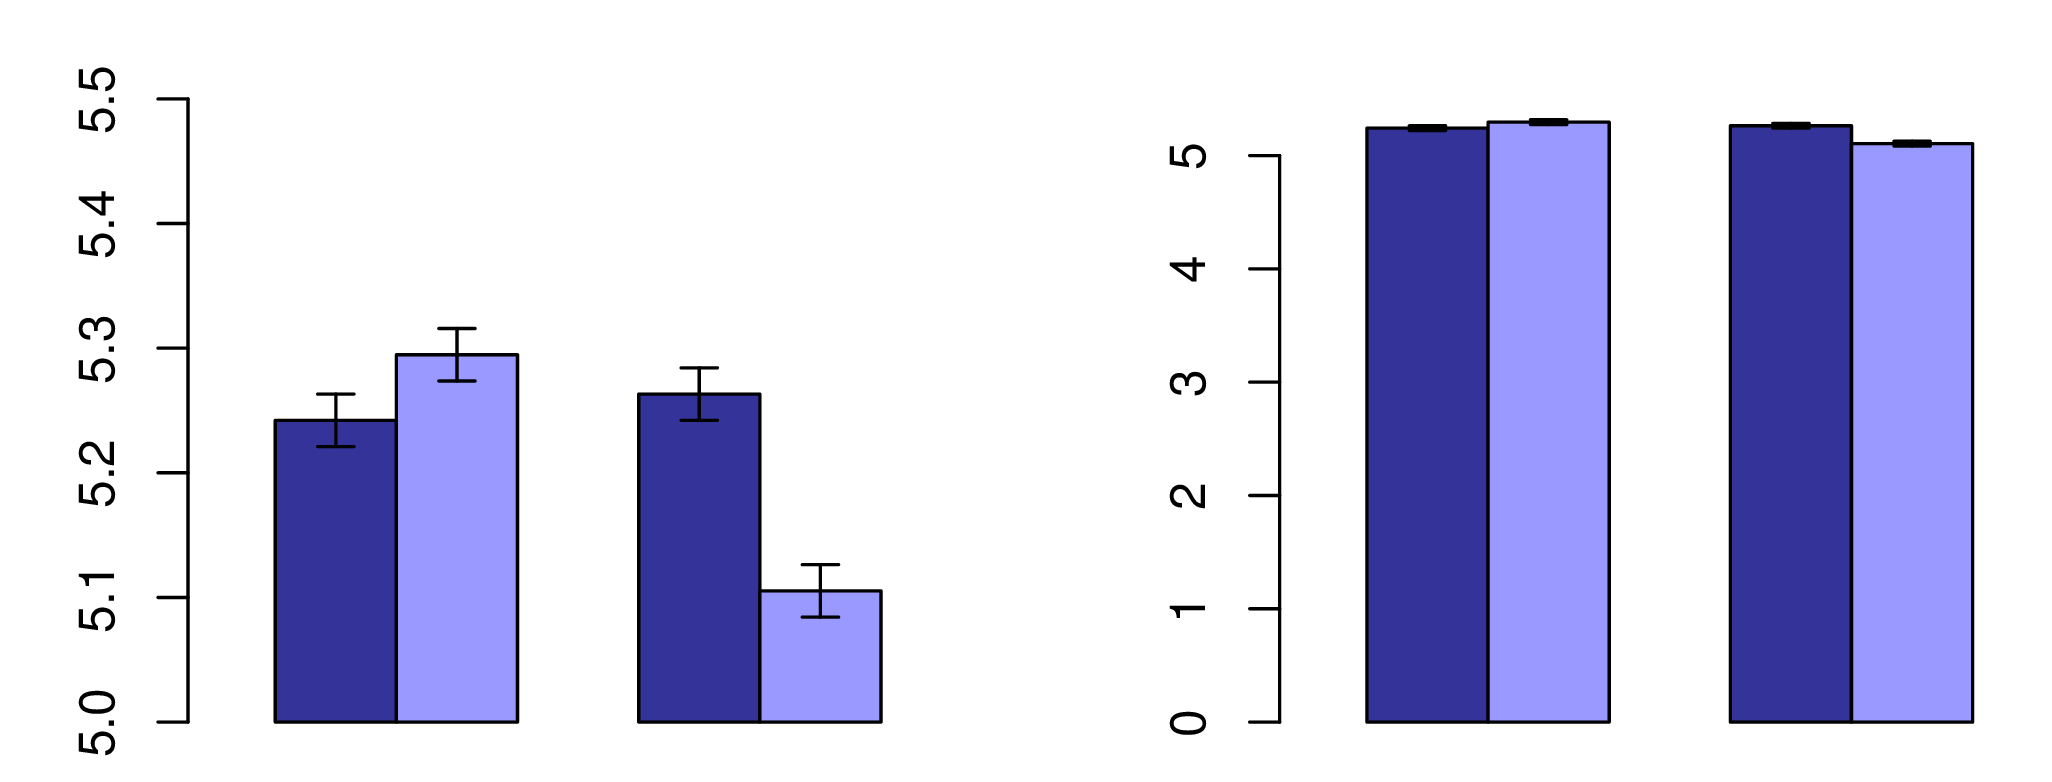 .myfootnote[ *Kramer, Adam DI, Jamie E. Guillory, and Jeffrey T. Hancock. "Experimental evidence of massive-scale emotional contagion through social networks." Proceedings of the National Academy of Sciences 111.24 (2014): 8788-8790.* ] ---  --- ## Avoid pie charts * Pie charts are bad at communicating information, just don't use them * Don't even mention 3D pie charts * There are tons of alternatives to pie charts .mycenter[ Humans are best at comparing lengths, good at comparing areas and really bad at comparing angles. Pie charts use angles to convey information. ] --- <!-- --> --- <!-- --> --- <!-- --> --- <!-- --> --- <!-- --> --- <!-- --> --- <!-- --> --- class:empty-slide,mywhite background-image:url(images/pacman.png) --- .mycenter[ It is not important which tools you use. It is important that you first come up with the idea how you want the data to be plotted, and that you can plot it – with whatever means you can. (Where should you look for a lost watch?) ] --- ## Bitmap vs vector graphics .pull-left[ Bitmap graphics (JPG, PNG, TIFF) <img src="weiner_BE_22_lecture_12_visualizations_files/figure-html/unnamed-chunk-12-1.png" width="200%" height="200%" /> ] -- .pull-right[ Vector graphics (PDF¹, SVG) <!-- --> ] .myfootnote[ ¹ PDF and SVG can also include bitmap graphics, so converting a bitmap file to PDF does not result in a higher quality. ] --- ## Example session We will now use world inequality data to create a bar plot. WIID (world income inequality database) includes quintiles of the income distribution. E.g. if `\(q_{1} = 10\)`, it means that the lower (in terms of income) `\(1/5\)` of the population gets 10% of the total GDP. In other words, if we order 100 persons according to their income, from lowest to highest, then the first 20 are getting 10% of the overall income. The closer the quintiles are to 20% for each group, the more egalitarian the society. --- First, we prepare the data using tidyverse. ```r wid <- read_excel("../../Datasets/WIID_19Dec2018.xlsx") wid <- wid %>% drop_na(gini_reported, q1:q5, d1:d10) wid2015 <- wid %>% filter(year==2015 & region_un == "Europe" & population > 5e6) wid2015sel <- wid2015 %>% filter(quality=="High") %>% filter(!duplicated(country)) %>% select(country, gini_reported, q1:q5, d1:d10) ## we mess the quantiles on purpose data <- wid2015sel %>% gather(q1:q5, key="quantile", value="proportion") %>% mutate(quantile=factor(quantile, levels=paste0("q", c(2, 1, 5, 4, 3)))) ``` --- ## Example session Now we pass the data to ggplot. ```r p <- data %>% ggplot(aes(country, proportion, fill=quantile)) + geom_bar(stat="identity") + coord_flip() p ``` * `coord_flip()` so the bar plot is horizontal * `geom_bar()` uses the `fill` esthetics --- ## Example session .center[ <img src="weiner_BE_22_lecture_12_visualizations_files/figure-html/wid01-1.svg" width="70%" /> ] --- ## First, reorder the quantile factor ```r data <- data %>% mutate(quantile=factor(quantile, levels=paste0("q", 5:1))) p <- data %>% ggplot(aes(country, proportion, fill=quantile)) + geom_bar(stat="identity") + coord_flip() p ``` <img src="weiner_BE_22_lecture_12_visualizations_files/figure-html/wid2-1.svg" width="50%" /> --- ## Reorder the countries ```r data <- wid2015sel %>% mutate(country=reorder(country, desc(gini_reported))) %>% gather(q1:q5, key="quantile", value="proportion") %>% mutate(quantile=factor(quantile, levels=paste0("q", 5:1))) p <- data %>% ggplot(aes(country, proportion, fill=quantile)) + geom_bar(stat="identity") + coord_flip() p ``` <img src="weiner_BE_22_lecture_12_visualizations_files/figure-html/wid3-1.svg" width="50%" /> --- ## Make it nice! ```r p + theme_tufte() + scale_fill_brewer(palette="Blues") + ylab("Proportion of wealth") + xlab("Country") + guides(fill=guide_legend(reverse=TRUE)) ``` --- ## Make it nice! .center[ <img src="weiner_BE_22_lecture_12_visualizations_files/figure-html/wid4-1.svg" width="70%" /> ] --- ### Eine kleine Farbenlehre Farbenlehre = Color theory * What is the function of color on the plot? * Does the color help or distract? * Do I *really* need color? * If you need more than five distinct colors (I don't mean a gradient), you probably are doing something wrong. --- ## Representing colors There are many ways to represent colors. In R, we most frequently use the RGB scheme in which each color is composed of three values for each of the three colors: red, green and blue. One way is to choose values between 0 and 1; another, between 0 and 255. The latter can be represented using hexadecimal notation, in which the value goes from 0 to FF (`15 * 16 + 15 = 255`). This is a very common notation, used also in HTML: * `"#FF0000"` or `c(255, 0, 0)`: red channel to the max, blue and green to the minimum. The result is color red. * `"#00FF00"`: bright green * `"#000000"`: black * `"#FFFFFF"`: white --- ## Getting the colors * To get the color from numbers in 0…1 range: rgb(0.5, 0.7, 0) # returns "#80B300" * To get the color from numbers in 0…255 range: rgb(255, 128, 0, maxColorValue=255) --- ## Alpha channel: transparency Useful way to handle large numbers of data points. `#FF000000`: fully transparent; `#FF0000FF`: fully opaque. ```r x <- rnorm(10000) y <- x + rnorm(10000) p1 <- ggplot(NULL, aes(x=x, y=y)) + geom_point() + theme_tufte() + theme(plot.margin=unit(c(2,1,1,1), "cm")) p2 <- ggplot(NULL, aes(x=x, y=y)) + geom_point(color="#6666661F") + theme_tufte() + theme(plot.margin=unit(c(2,1,1,1),"cm")) plot_grid(p1, p2, labels=c("Black", "#6666661F")) ``` --- ## Alpha channel: transparency Useful way to handle large numbers of data points. `#FF000000`: fully transparent; `#FF0000FF`: fully opaque. <!-- --> --- ## Other color systems There are several other representations of color space, and they do not give exactly the same results. Two common representations are HSV and HSL: Hue, Saturation and Value, and Hue, Saturation and Luminosity.  --- ## Manipulating colors There are many packages to help you manipulate the colors using hsl and hsv. For example, my package `plotwidgets` allows you to change it using the HSL model. ```r library(plotwidgets) ## Now loop over hues pal <- plotPals("zeileis") v <- c(10, 9, 19, 9, 15, 5) a2xy <- function(a, r=1, full=FALSE) { t <- pi/2 - 2 * pi * a / 360 list( x=r * cos(t), y=r * sin(t) ) } plot.new() par(usr=c(-1,1,-1,1)) hues <- seq(0, 360, by=30) pos <- a2xy(hues, r=0.75) for(i in 1:length(hues)) { cols <- modhueCol(pal, by=hues[i]) wgPlanets(x=pos$x[i], y=pos$y[i], w=0.5, h=0.5, v=v, col=cols) } pos <- a2xy(hues[-1], r=0.4) text(pos$x, pos$y, hues[-1]) ``` --- ## Manipulating colors There are many packages to help you manipulate the colors using hsl and hsv. For example, my package `plotwidgets` allows you to change it using the HSL model. .center[ <!-- --> ] --- ## Palettes It is not easy to get a nice combination of colors (see default plot in ggplot2 to see how *not* to do it). There are numerous palettes in numerous packages. One of the most popular is `RColorBrewer`. You can use it with both base R and `ggplot2`. --- ## RColorBrewer palettes ```r library(RColorBrewer) par(mar=c(0,4,0,0)) display.brewer.all() ``` --- ## RColorBrewer palettes .center[ <!-- --> ] --- ## RColorBrewer palettes: color blind ```r par(mar=c(0,4,0,0)) display.brewer.all(colorblindFriendly=T) ``` --- ## RColorBrewer palettes: color blind .center[ <!-- --> ] --- ## Iris data set .pull-left[ ```r data("iris") ``` ] .pull-right[  ] .myfootnote[ *The use of multiple measurements in taxonomic problems as an example of linear discriminant analysis.* Fisher 1936 ] --- ## Gallery of RColorBrewer palettes: Dark2 <!-- --> --- ## Pastel1 <!-- --> --- ## Paired <!-- --> --- ## Set2 <!-- --> --- ## The viridis scale For base R, use the following code: ```r library(scales) pal <- viridis_pal()(n=6) show_col(pal) ``` <!-- --> --- ## The viridis scale Implemented in ggplot functions: * `scale_(color|fill)_viridis_(c|d)` * `c` for continuous, `d` for discrete e.g. ```r ggplot(iris, aes(x=Sepal.Length, y=Sepal.Width, color=Species)) + geom_point(size=4) + scale_color_brewer(palette="Set2") + theme_tufte() + theme(axis.title.y=element_text(margin=margin(0,10,0,0)), axis.title.x=element_text(margin=margin(10, 0, 0, 0))) + scale_color_viridis_d() ``` --- ## The viridis scale <!-- --> --- ## Other sources * my package `plotwidgets` implements a couple of other palettes * You can always define your own colors! * Use a color picker to "steal" palettes that you think are nice * You can use [this tool](https://davidmathlogic.com/colorblind/) or [this one](https://projects.susielu.com/viz-palette) to design colorblind friendly palettes --- ## plotwidget palettes <img src="weiner_BE_22_lecture_12_visualizations_files/figure-html/plotwidgetspals-1.svg" width="70%" /> --- ## The gapminder data set ```r library(gapminder) data(gapminder) ``` --- .mycenter[ Gallery of shame ] --- class:empty-slide,myinverse background-image:url(images/useless_murders.jpg) --- class:empty-slide,myinverse background-image:url(images/useless_deaths.jpg) --- class:empty-slide,myinverse background-image:url(images/useless_welfare.png) --- class:empty-slide,myinverse background-image:url(images/useless_welfare.png) --- class:empty-slide,myinverse background-image:url(images/useless_global_warming.png) --- class:empty-slide,myinverse background-image:url(images/useless_global_warming_2.png) --- ## From data to figures * What is the message of the figure? * What data should be shown on a plot? * What relationships do you want to illustrate? * If it is tricky – I start with a pencil and a clean piece of paper! --- ## Factfulness .mycenter[ *“The world cannot be understood without numbers. But the world cannot be understood with numbers alone.”* ― Hans Rosling, Factfulness: *Ten Reasons We're Wrong About the World—and Why Things Are Better Than You Think* ] --- ## Loading the gapminder data set ```r library(ggplot2) theme_set(theme_bw()) library(gapminder) knitr::kable(head(gapminder)) ``` <table> <thead> <tr> <th style="text-align:left;"> country </th> <th style="text-align:left;"> continent </th> <th style="text-align:right;"> year </th> <th style="text-align:right;"> lifeExp </th> <th style="text-align:right;"> pop </th> <th style="text-align:right;"> gdpPercap </th> </tr> </thead> <tbody> <tr> <td style="text-align:left;"> Afghanistan </td> <td style="text-align:left;"> Asia </td> <td style="text-align:right;"> 1952 </td> <td style="text-align:right;"> 28.801 </td> <td style="text-align:right;"> 8425333 </td> <td style="text-align:right;"> 779.4453 </td> </tr> <tr> <td style="text-align:left;"> Afghanistan </td> <td style="text-align:left;"> Asia </td> <td style="text-align:right;"> 1957 </td> <td style="text-align:right;"> 30.332 </td> <td style="text-align:right;"> 9240934 </td> <td style="text-align:right;"> 820.8530 </td> </tr> <tr> <td style="text-align:left;"> Afghanistan </td> <td style="text-align:left;"> Asia </td> <td style="text-align:right;"> 1962 </td> <td style="text-align:right;"> 31.997 </td> <td style="text-align:right;"> 10267083 </td> <td style="text-align:right;"> 853.1007 </td> </tr> <tr> <td style="text-align:left;"> Afghanistan </td> <td style="text-align:left;"> Asia </td> <td style="text-align:right;"> 1967 </td> <td style="text-align:right;"> 34.020 </td> <td style="text-align:right;"> 11537966 </td> <td style="text-align:right;"> 836.1971 </td> </tr> <tr> <td style="text-align:left;"> Afghanistan </td> <td style="text-align:left;"> Asia </td> <td style="text-align:right;"> 1972 </td> <td style="text-align:right;"> 36.088 </td> <td style="text-align:right;"> 13079460 </td> <td style="text-align:right;"> 739.9811 </td> </tr> <tr> <td style="text-align:left;"> Afghanistan </td> <td style="text-align:left;"> Asia </td> <td style="text-align:right;"> 1977 </td> <td style="text-align:right;"> 38.438 </td> <td style="text-align:right;"> 14880372 </td> <td style="text-align:right;"> 786.1134 </td> </tr> </tbody> </table> --- ## First plot ```r gapminder %>% ggplot(aes(x=gdpPercap, y=lifeExp, color=year)) + geom_point() ``` <!-- --> --- ## First plot ```r gapminder %>% ggplot(aes(x=gdpPercap, y=lifeExp, color=year)) + geom_point() + scale_x_log10() ``` <!-- --> --- ## First plot ```r gapminder %>% ggplot(aes(x=gdpPercap, y=lifeExp, color=year)) + geom_point() + scale_x_log10() + scale_color_viridis_c() ``` <!-- --> --- ## Select only one year ```r gapminder %>% filter(year==2007) %>% ggplot(aes(x=gdpPercap, y=lifeExp, color=continent)) + geom_point() + scale_x_log10() + scale_color_brewer(palette="Dark2") ``` <!-- --> --- ## Add population data ```r gapminder %>% filter(year==2007) %>% ggplot(aes(x=gdpPercap, y=lifeExp, size=pop, color=continent)) + geom_point() + scale_x_log10() + scale_color_brewer(palette="Dark2") ``` <!-- --> --- ## Nicer colors from gapminder ```r gapminder %>% filter(year==2007) %>% ggplot(aes(x=gdpPercap, y=lifeExp, size=pop, color=country)) + geom_point(alpha=.7, show.legend=FALSE) + scale_color_manual(values=country_colors) + scale_x_log10() ``` <!-- --> --- ## Comparison year 1952 and 2007 ```r g1952 <- gapminder %>% filter(year == 1952) %>% ggplot(aes(x=gdpPercap, y=lifeExp, color=continent)) + geom_point() + scale_color_brewer(palette="Dark2") + xlim(range(gapminder$gdpPercap)) + ylim(range(gapminder$lifeExp)) + scale_x_log10() g2007 <- gapminder %>% filter(year == 2007) %>% ggplot(aes(x=gdpPercap, y=lifeExp, color=continent)) + geom_point() + scale_color_brewer(palette="Dark2") + xlim(range(gapminder$gdpPercap)) + ylim(range(gapminder$lifeExp)) + scale_x_log10() plot_grid(g1952, g2007) ``` --- ## Comparison year 1952 and 2007 <!-- --> --- ## Comparison year 1952 and 2007 Much easier! ```r gapminder %>% filter(year %in% c(1952, 2007)) %>% ggplot(aes(x=gdpPercap, y=lifeExp, color=continent)) + scale_color_brewer(palette="Dark2") + geom_point() + facet_grid(. ~ year) + scale_x_log10() ``` <!-- --> --- ## Add population data ```r gapminder %>% filter(year %in% c(1952, 2007)) %>% ggplot(aes(x=gdpPercap, y=lifeExp, size=pop, color=continent)) + scale_color_brewer(palette="Dark2") + geom_point() + facet_grid(. ~ year) + scale_x_log10() ``` <!-- --> --- ## Slope diagram ```r tmp <- gapminder %>% filter(year %in% c(1952, 2007)) %>% group_by(continent, year) %>% summarise(mean=mean(gdpPercap), median=median(gdpPercap)) tmp %>% ggplot(aes(x=year, y=mean, color=continent)) + geom_point() + geom_line() + scale_y_log10() + geom_label(aes(label=continent), hjust="outward", show.legend=F) + xlim(1945, 2020) ``` --- ## Slope diagram <!-- --> --- ## Dumbbell chart ```r gapminder %>% filter(year %in% c(1952, 2007) & continent=="Europe") %>% arrange(gdpPercap, year) %>% mutate(country=factor(country, levels=unique(country))) %>% ggplot(aes(x=gdpPercap, y=country, color=year)) + geom_point() + geom_line() ``` --- ## Dumbbell chart <!-- --> --- ## Let's move it ```r library(gganimate) g <- gapminder %>% ggplot(aes(x=gdpPercap, y=lifeExp, size=pop, color=continent)) + geom_point(alpha=.8) + scale_color_brewer(palette="Dark2") + scale_x_log10() + scale_size(range = c(2, 12)) + transition_time(year) + labs(title = 'Year: {frame_time}', x = 'GDP per capita', y = 'life expectancy') + ease_aes("linear") animate(g, duration = 15, fps = 20, width = 800, height = 500, renderer = av_renderer()) anim_save("gapminder.mp4") ``` **Warning:** `gganimate` has *huge* installation requirements, because you need a renderer library. Depending on your system, this might take a lot of disk space / a lot of headache. For example, using the `gifski` package requires you to install the rust environment. Also, including in rmarkdown might be problematic. --- ## Let's move it <video controls autoplay><source src="images/gapminder.mp4" type="video/mp4"></video>